Interactive Map
Introduction
The Interactive Map is the cornerstone of our Country Watch web application, serving as the primary interface for accessing vital information about the safety landscape in Mexico. This dynamic map allows you to explore Mexico's states visually, providing valuable insights into regional risk assessments at a glance.
The Interactive Map employs a choropleth map representation, which uses color to convey risk information. Each state on the map is color-coded based on the chosen risk indicator, allowing you to quickly discern varying levels of risk across the country.
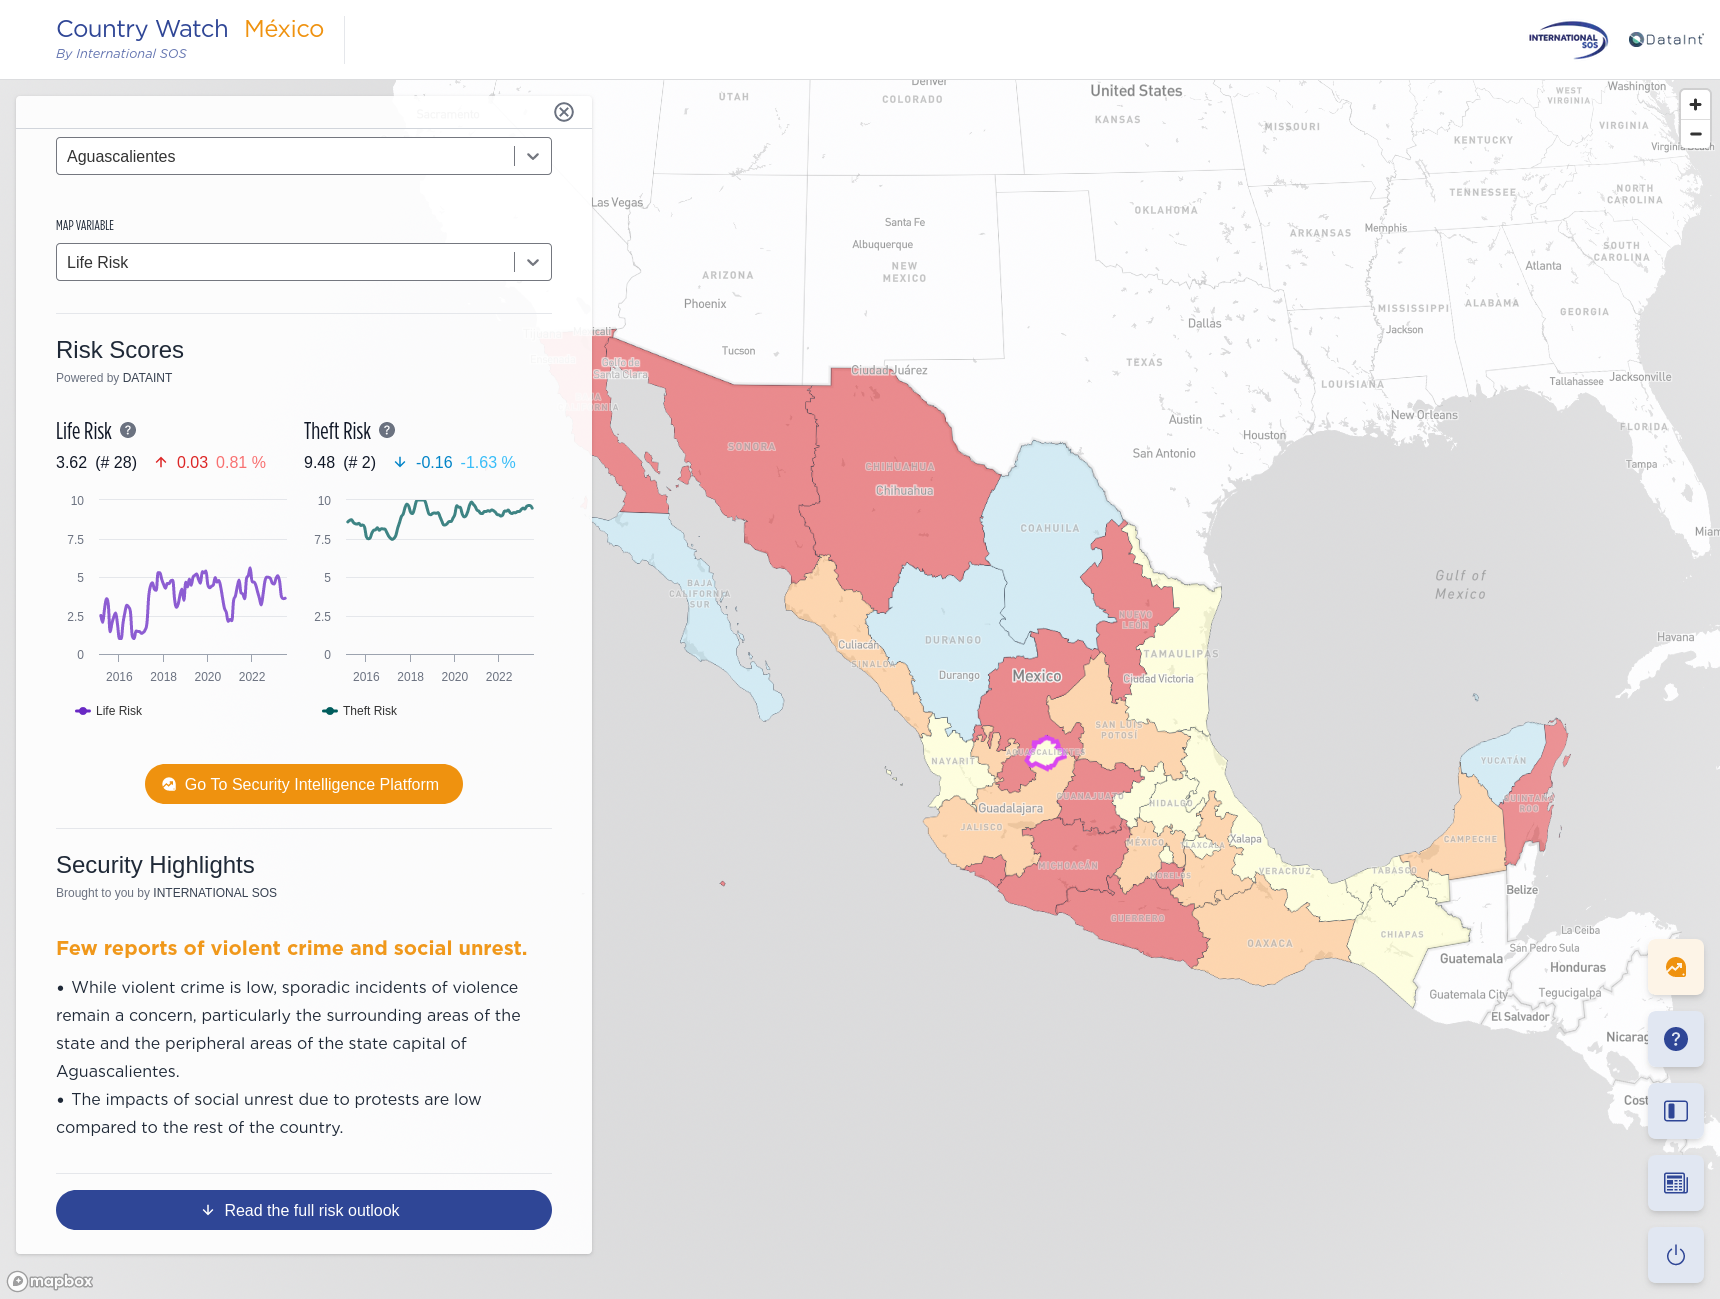
Interactive Exploration
The Interactive Map in Country Watch provides a user-friendly and dynamic way to explore Mexico's safety landscape. Here's how you can interact with the map:
Navigating the Map
- Click and Drag: To move the map camera, simply click and drag your mouse cursor on the map. This allows you to explore different regions and states within Mexico.
- Zoom In and Out: Use your mouse's scrolling wheel to zoom in and out on the map. Zooming in allows for a closer look at specific areas, while zooming out provides a broader view of the entire country. You can also use the zoom control buttons (located at the top-right corner of the map) to zoom in and out on the map.
Selecting a State
- Click on any of the 32 states in Mexico to select it. When a state is selected, it will be outlined with a magenta-colored border, making it easily identifiable on the map. Upon clicking a state, the Information Panel on the left side of the map will open. This panel provides detailed risk information for the selected state, including:]
- Risk Outlook: Information about the current safety conditions and outlook for the selected state.
- Theft Risk Index: Historical data on theft risk in the state.
- Life Risk Index: Historical data on life risk in the state.
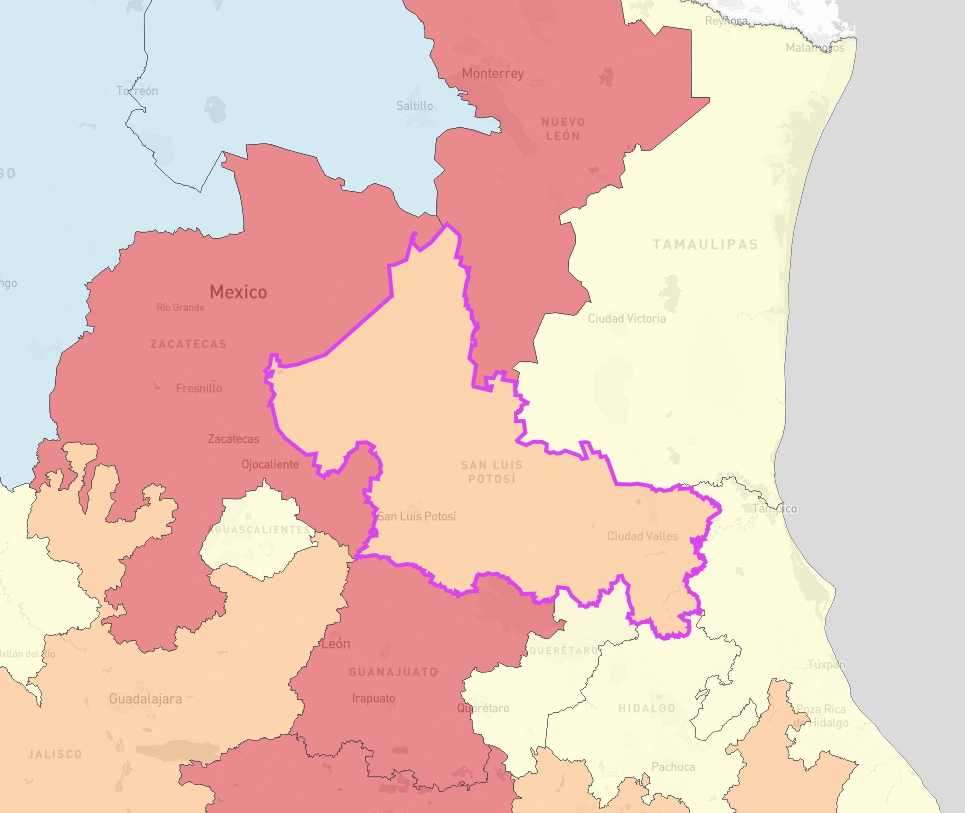
You can select a state by clicking on it. The selected state will be outlined with a magenta-colored border.
By clicking on different states and exploring the Information Panel, you can gain valuable insights into the safety assessments and historical risk data for each region in Mexico.
The Interactive Map is designed to provide you with a rich and interactive experience, enabling you to make informed decisions based on statistical and historical risk information.
Visual Risk Assessment
The Interactive Map in Country Watch employs a choropleth map to provide you with a visual representation of safety assessments across Mexico's 32 states. This approach offers a clear and intuitive way to understand regional risk levels based on selected risk scores.
Choropleth Map Explained
A choropleth map is a thematic map that uses color shading to represent spatial variations of a variable across geographic areas or regions, in this case, Mexico's states. Each state on the map is color-coded based on the value of the chosen risk index, allowing for a quick assessment of relative risk levels.
Diverging Color Scale
To enhance the clarity of the risk assessment, we use a diverging color scale. This scale categorizes states into five distinct risk categories, utilizing the Jenks natural breaks algorithm for optimal data grouping. The color scale progresses from blue to red, with each color representing a different level of risk:
- Blue (Safest): States in this category are considered the safest in the selected risk index.
- Light Blue: States with a slightly higher risk level but still relatively safe.
- Yellow: States with a moderate level of risk.
- Orange: States with a higher risk level.
- Red (Riskiest): States in this category represent the highest level of risk in the selected index.
By visually distinguishing risk levels with a diverging color scale, you can quickly identify areas of interest and assess safety conditions across Mexico. This intuitive representation allows you to make informed decisions based on the relative risk levels displayed on the map.
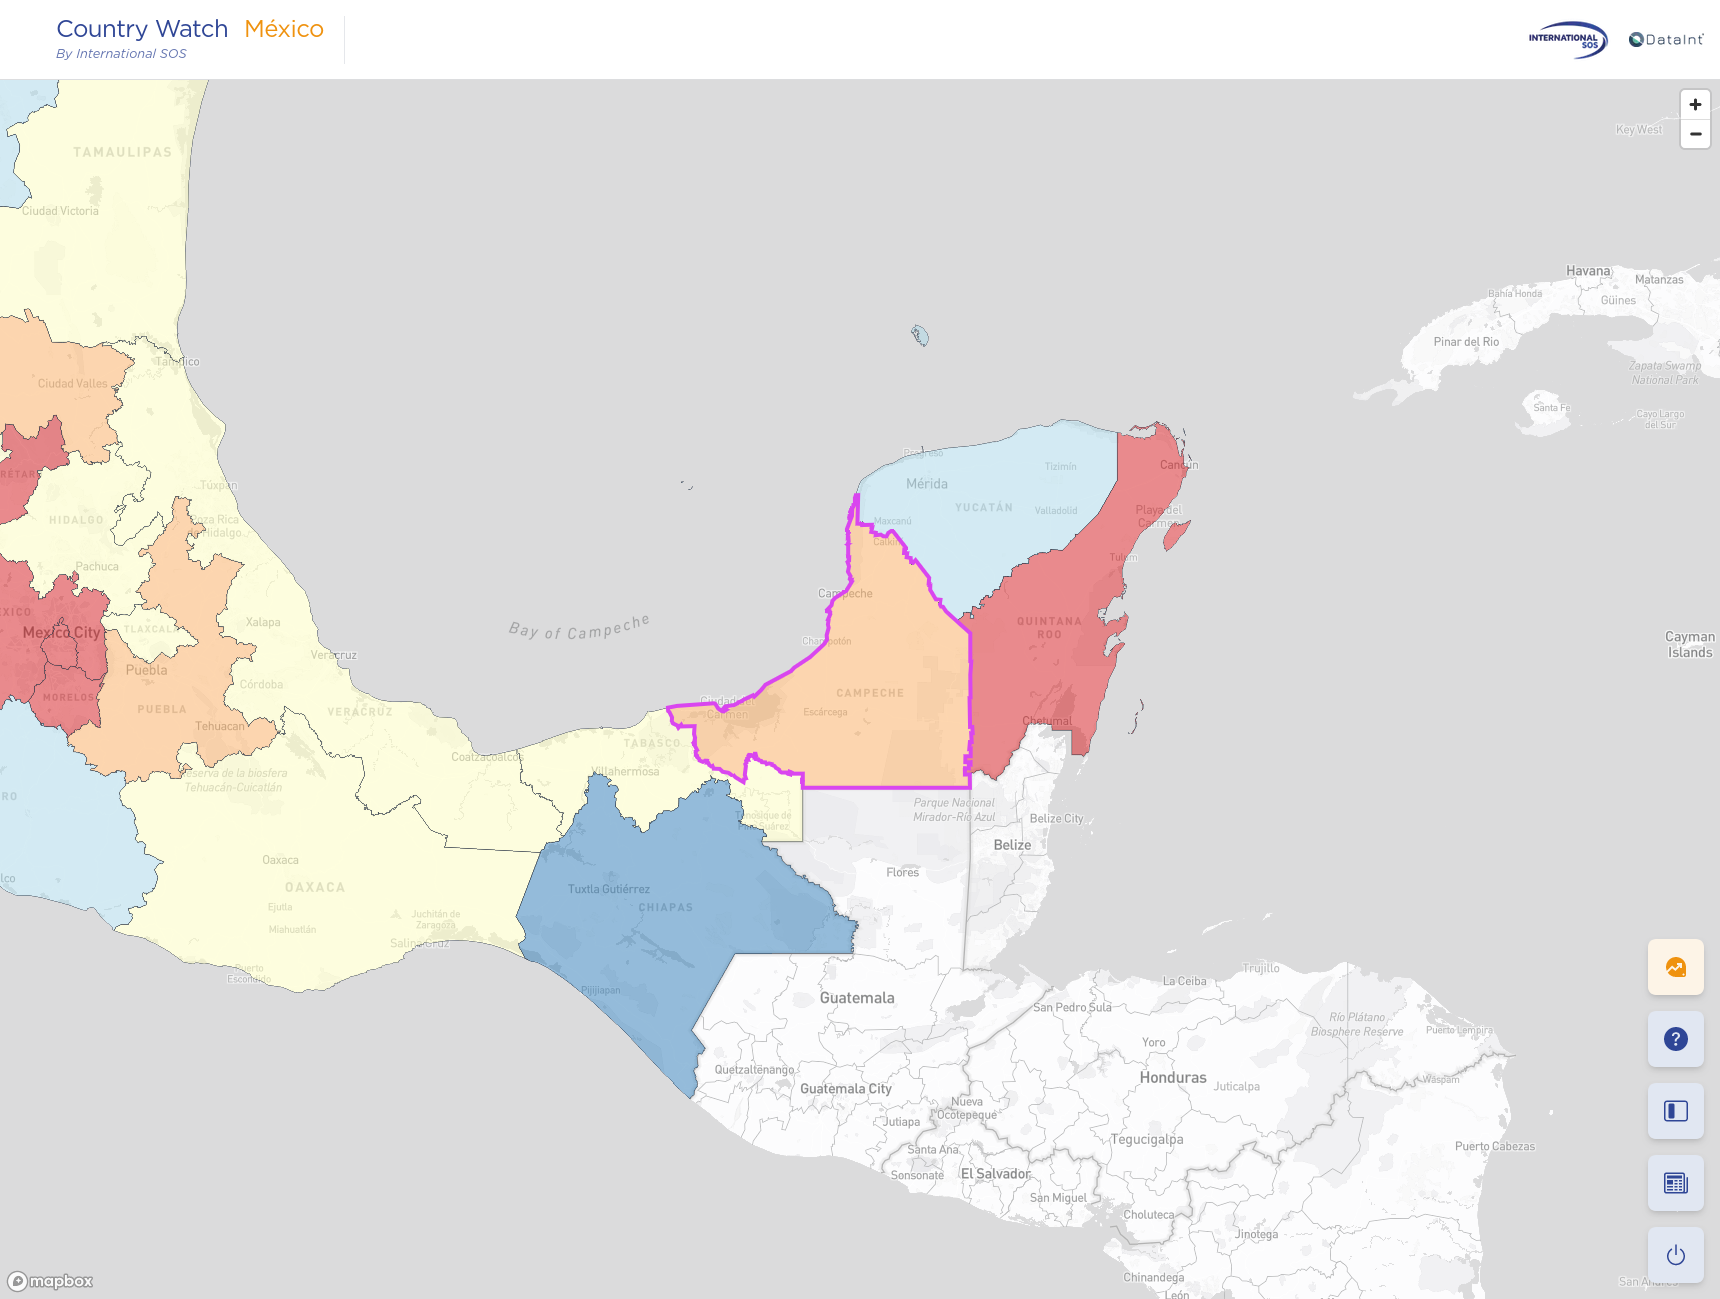
We use a diverging color scale that goes from blue (safest) to red (riskiest). This example depicts southern states colored based on the Theft Risk Index for August 2023. The user can quickly identify the safest and riskiest states in the region (Chiapas and Quintana Roo, respectively).
Information Panel
The Information Panel, located on the left side of the Interactive Map, serves as a comprehensive resource for accessing essential information related to risk assessments for Mexico's states.
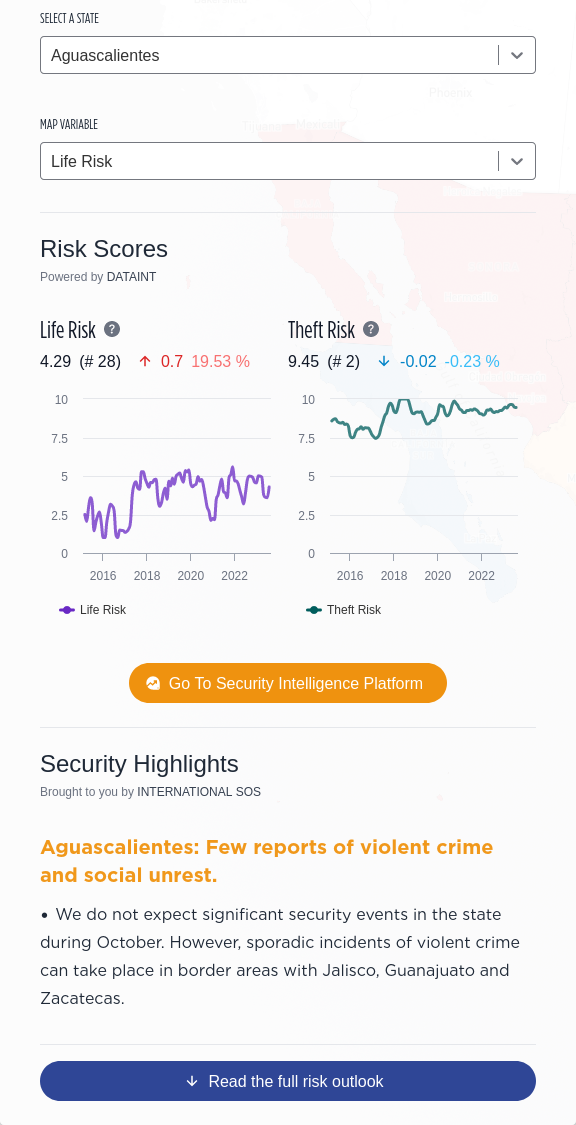
The Information Panel is located on the left side of the Interactive Map and is the main component our application uses to display relevant information on the selected state.
The Information Panel is divided into 3 sections:
Map Controls
The Map Controls section provides you with the tools to customize your map-viewing experience. Here is what you can find in this section:
- State Selection: Choose which state to view risk information for by selecting it from a dropdown menu. The map will update accordingly, highlighting your selected state.
- Risk Indicator: Select the risk index of interest from the available options, such as life risk or theft risk. The map will dynamically recolor the states based on your selection.
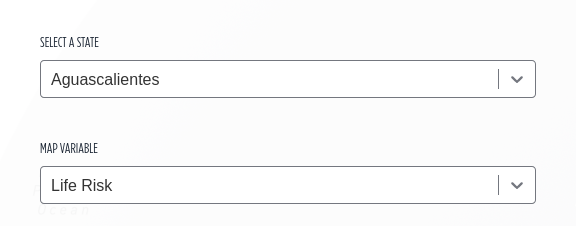
This is the Map Controls. This section in the Information Panel empowers you to tailor your map-viewing experience. Easily select a different state or switch to a new risk index, and watch as the map dynamically recolors the states to match your preferences.
Risk Scores
The Risk Scores section offers valuable insights into the historical trends of two key risk scores: the Life Risk Index and the Theft Risk Index. These time series provide a historical perspective on risk levels in the selected state, allowing you to track changes over time.
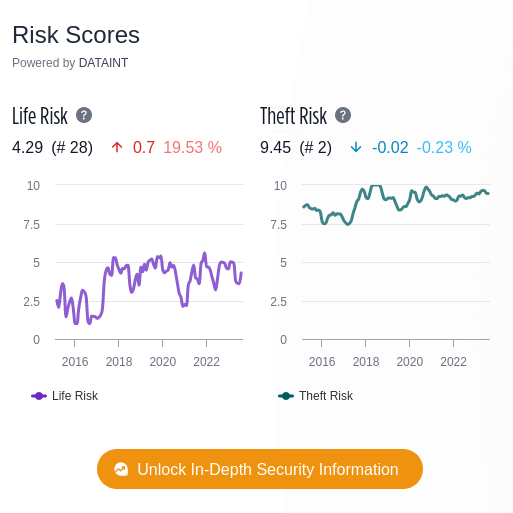
Each time series includes the following details right under its title:
- Most Recent Value: The first number represents the most recent value of the risk index for the selected state.
- Ranking: The second number reflects the ranking of the selected state in terms of the risk index in question compared to other states. This number is between parenthesis.
- Nominal Change: The third number indicates the nominal change in the index versus the last month, providing insights into the direction and magnitude of change.
- Relative Change (%): The fourth number represents the relative (percent) change in the index versus the last month, helping you understand the percentage increase or decrease in risk.

The numbers under each time series title help you gain a quick insight on the selected state current score and how it has changed compared with the last month.
DataInt Security Dashboard Access
Below the time series, you will find a button that provides direct access to the DataInt dashboard —a comprehensive data repository featuring more than 150 crime categories, along with data for Mexico's 32 states and over 2400 municipalities. Please note that access to the DataInt dashboard is exclusively available to users with a full subscription to the services of International SOS and DataInt. Click the button to explore in-depth crime data and gain additional insights to support your risk assessments.
This feature allows eligible users to access an extensive range of data resources, enhancing their ability to make informed decisions based on a comprehensive understanding of safety conditions in Mexico.
Risk Outlook
The Risk Outlook section within the Information Panel provides you with a concise yet informative overview of the security landscape for the selected state. Here, you can access essential security insights, including:
- Brief Risk Summary: Get a quick snapshot of the main security risks associated with the selected state. This summary highlights the key factors contributing to the state's risk profile.
- Monthly Security Events: Stay up-to-date with relevant security events and incidents that occurred in the selected state during the month. This summary offers insights into recent developments that may impact safety conditions.
- Recommended Mitigation Strategies: Gain access to expert-recommended mitigation strategies tailored to the specific security challenges of the selected state. These strategies can help you plan and take proactive measures to enhance safety.
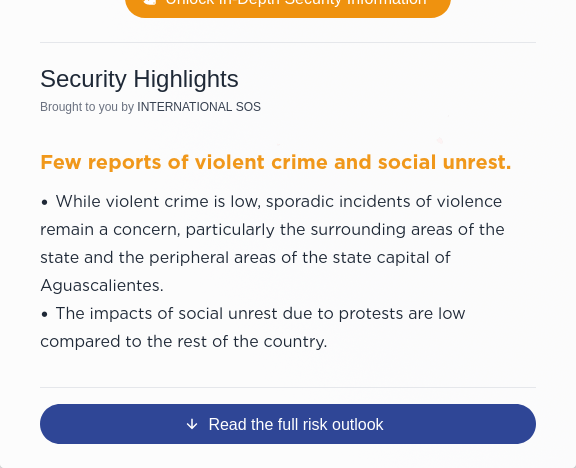
The Risk Outlook section is located at the bottom of the Information Panel. There you will find a concise yet informative overview of the security landscape for the selected state.
The Risk Outlook section is divided into two distinct components:
1. Security Highlights (Executive Summary): Located at the bottom of the Information Panel, the Security Highlights offer an executive summary of the risk panorama for the selected state. This concise overview highlights the primary security risks and recent security events in a brief format, providing users with quick and essential information at a glance.
2. Full Risk Outlook: For more in-depth information, users can access the Full Risk Outlook by clicking the "Read the full risk outlook" button. This section presents a detailed and comprehensive analysis of the security situation in the selected state. It includes a thorough examination of risk factors, recent security events, and a comprehensive set of expert-recommended mitigation strategies. This detailed resource equips users with a comprehensive understanding of security conditions to make informed decisions.
The Risk Outlook section empowers you with the flexibility to access summarized security highlights for quick insights or delve into a more extensive full risk outlook for a comprehensive analysis. It's your go-to resource for enhancing situational awareness and effective risk management.
We encourage you to leverage the Risk Outlook to stay informed, plan effectively, and make data-driven decisions in response to the dynamic security challenges faced in Mexico's states. Your safety and preparedness are our top priorities, and the Risk Outlook is here to support you every step of the way.
Actions Panel
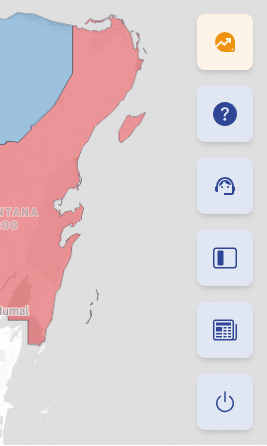
The Actions Panel is located at the bottom right side of the map. It’s a convenient control center for accessing key functionalities within the Country Watch dashboard
The Actions Panel, located at the bottom right side of the map, is a convenient control center for accessing key functionalities within the Country Watch dashboard. Here, you can find a group of buttons that allow you to perform various actions:
1. Go to DataInt Security Dashboard (Eligible Users Only): Clicking this button opens the DataInt Security Dashboard, providing access to a comprehensive data repository with extensive information on security-related topics. Please note that access to the DataInt Security Dashboard is available exclusively to eligible users with the necessary subscriptions.
2. Open the Documentation: Access the documentation for Country Watch by clicking this button. The documentation is your go-to resource for understanding the features and functionalities of the dashboard, enabling you to maximize its utility.
3. Contact the Support Team: Use this button to send an email to our support team.
4. Toggle the Information Panel: Use this button to toggle the visibility of the Information Panel on the left side of the map. When you need to focus on the map or expand your view, you can easily hide or reveal the Information Panel as needed.
5. Toggle the Featured Article Modal: Clicking this button opens or closes the Featured Article Modal.
6. Logout from Country Watch: When you're done with your session, use this button to securely log out from your Country Watch account. This action ensures the protection of your data and privacy.
The Actions Panel simplifies your interaction with the dashboard, offering quick access to important features and functionalities. Whether you need to access additional resources, navigate the documentation, or control the visibility of panels, the Actions Panel puts these capabilities at your fingertips.
Sources
The data and technology powering the Country Watch dashboard are derived from reputable sources and providers to ensure accuracy and reliability:
1. Map Technology - MapBox:
- The interactive map technology utilized in Country Watch is provided by MapBox. MapBox offers cutting-edge mapping capabilities that enable users to explore geographical data with precision and interactivity.
2. Vector Data - Instituto Nacional de Estadística y Geografía (INEGI):
- The vector data used to create the choropleth map, which visually represents Mexico's states and regions, is sourced from the Instituto Nacional de Estadística y Geografía (INEGI). INEGI is the national statistical institute of Mexico, known for its authoritative geospatial data.
3. Risk Scores - DataInt:
- The Risk Scores displayed in Country Watch are provided by DataInt. These scores are based on comprehensive data from multiple sources, including the Secretariado Ejecutivo del Sistema Nacional de Seguridad Pública (SESNSP) and the Consejo Nacional de Población (CONAPO). DataInt's expertise in data analysis and risk assessment ensures the accuracy and relevance of the risk index data.
4. Risk Outlook Content - International SOS:
- The content within the Risk Outlook section is sourced from International SOS, a trusted leader in health and security services. International SOS provides expert analysis and insights to assess security risks effectively. The Risk Outlook content encompasses information on crime, natural hazards, social movements, and recommended mitigation strategies.